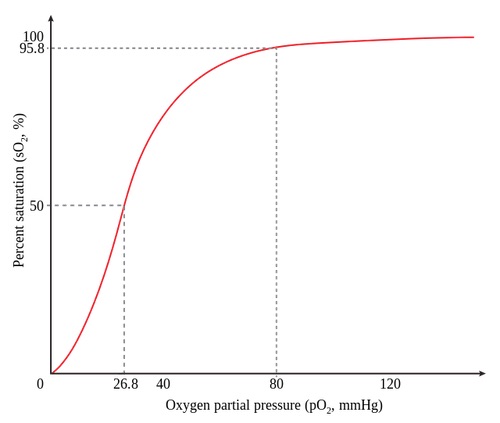
Oxygen-Hemoglobin Dissociation Curve
- Compares Partial Pressure of Oxygen (PO2) vs Percent Oxygen Saturation of Hemoglobin
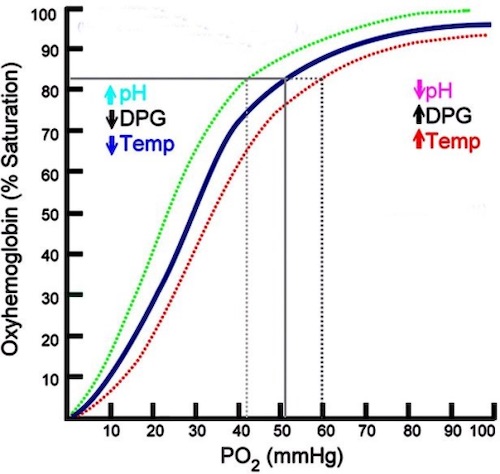
- Shifts:
- Rightward Shift – Causes Decreased Affinity & Increased O2 Unloading
- Leftward Shift – Causes Increased Affinity & Support O2 Binding
- Factors that Cause Rightward Shift:
- Increased CO2
- Increased Temperature
- Increased H+ (Decreased pH)
- Increased 2,3-DPG (2,3-Diphosphoglycerate)
- Hypoxia Causes Decreased Affinity for Oxygen Due to 2,3-DPG Having Increased Affinity for Deoxygenated Hemoglobin
- Fetal Hemoglobin Has a Low Affinity for 2,3-DPG Resulting in Overall Higher Affinity for Oxygen
- Factors that Cause a Leftward Shift:
- Decreased CO2
- Decreased Temperature
- Decreased H+ (Decreased pH)
- Decreased 2,3-DPG (2,3-Diphosphoglycerate)
Oxygenation Parameters
- CaO2: Arterial O2 Content
- SaO2: Percent Arterial Saturation of Hgb
- SpO2: Peripheral Capillary Oxygen Saturation
- Estimates SaO2
- Detected by Pulse Oximeter
- *May Have a Bias of +2% with Darkly-Pigmented Skin
- PaO2: Partial Pressure of Dissolved O2 in Blood (Arterial “Oxygen Tension”)
- Hypoxic Definitions:
- Hypoxemia: Low Oxygen Content in Blood
- Hypoxia: Low Oxygen Content in Tissues
Arterial O2 Content (CaO2)
- CaO2 = (Hgb x SaO2 x 1.34) + (PaO2 x 0.003)
- Oxygen Carrying Capacity = 1.34
- Most Important Determinant: Hgb
- PaO2 Only Contributes 1-2%
Pulse Oximetry vs Arterial Blood Gas
- Pulse Oximetry is Generally Superior to ABG in Measuring Oxygenation
- ABG Challenges:
- Expensive, Painful & Time Consuming
- Blood Loss
- May be Contaminated with Venous Blood
- Although a Better Measure of Lung Function, Pulse Ox Better Measures Systemic Delivery
- Often Misinterpreted – (SpO2 of 88% Correlates with PaO2 of 55 mmHg)
- When ABG is Preferred:
- If Pulse Oximeter Waveform is Unreliable
- P/F Ratio Calculation in ARDS
- Diagnosis of Methemoglobinemia
Oxygen Extraction
- Oxygen Extraction Ratio = (CaO2 – CvO2) / CaO2
- Average: 0.25-0.30
- Highest in Coronary Circulation & Brain Tissue
- Increases as O2 Consumption Increases
- Oxygen Delivery:Consumption Ratio: 4:1
- Oxygen Delivery Dependent on: Cardiac Output & CaO2
- Determinants of Myocardial Oxygen Consumption: Wall Tension (#1) & Heart Rate
Venous Oxygen Saturation
- Mixed Venous Oxygen Saturation (SvO2): 70-75%
- Generally Measured from Pulmonary Artery
- True Value Would Be at IVC & Coronary Sinus
- Venous Oxygen Saturation:
- Highest: Renal Veins (80%)
- Lowest: Coronary Sinus (30%)